On this page
Socialinsider's 2026 report puts average business Page engagement at 5.20%, up 8% year over year. That headline describes its 2025 data, not a full-year 2026 result. Its newer Q2 2026 update has multi-image posts leading at 6.90%, followed by native documents at 6.60%.
A useful LinkedIn engagement rate benchmark must match your account type, denominator and reporting period. A company Page's interactions per impression cannot be compared directly with a creator profile's rate from a public-data tool. Compare post formats, creator quartiles and comment-reply findings using the definitions and reporting periods below.
Choose the benchmark that matches your account
For company Pages, 4–6% “good” and 6–10% “excellent” are planning bands, not measured percentiles. Personal profiles need a separate comparison by size and reporting method.
- Company Page: annual Page benchmarks, including Socialinsider's 5.20% overall average from 2025 observations, measured by impressions.
- Current Page formats: Q2 2026 format averages, for organic business Page engagement by impressions.
- Personal profile: creator quartiles by follower count, from Favikon's January 2026 report. Its formula and observation window are unstated.
- Replying to comments: Buffer's within-profile comparison, which found about 30% higher engagement counts on posts with replied-to comments, from January 2025 onward.
For SDRs and AEs, also track which target accounts respond and which conversations have a useful next step. Those outcomes need a separate scorecard from post engagement.
What is LinkedIn engagement rate?
Engagement rate expresses interactions relative to a denominator such as impressions or followers. It is a ratio, not a count of unique people. One person can see a post more than once and perform more than one action.
The numerator matters too. Some reports include clicks; others count only public reactions, comments and reposts. A higher rate can reflect a smaller denominator, more interactions, or both. Read the definition before treating it as evidence that one account's content is better.
How do you calculate LinkedIn engagement rate?
Impression-based engagement rate for Pages
LinkedIn's Page analytics definition uses interactions divided by impressions. Interactions include clicks, reactions, comments and shares:
(Clicks + reactions + comments + shares) ÷ impressions × 100
Impressions count displays, not unique viewers. Use the fields in your Page analytics export and keep organic and paid results separate. Personal-profile analytics and third-party exports may expose different fields; the Page definition does not establish an identical native metric for every personal-profile report.
Follower-based engagement rate for public comparisons
When impressions are unavailable, a public-data calculation can use:
(Reactions + comments + shares) ÷ followers × 100
This measures interactions relative to audience size, rather than exposure. It is not an estimate of the percentage of viewers who engaged. Follower-based rates are not always lower than impression-based rates: the result depends on the underlying follower and impression counts, as well as the numerator.
Do not convert between the two using percentages alone. You need the original counts. Use Extrovert's free LinkedIn engagement rate calculator for the calculation, then compare only with a report using matching inputs.
A monthly rate is different from an average post rate
For your monthly impression-based rate, add the included interactions across posts, divide by their combined impressions, then multiply by 100. To calculate the average post rate, calculate each post's percentage first and take the mean. The first gives more weight to posts with more impressions; the second gives every post equal weight.
Keep the calculation consistent from month to month. Socialinsider labels its figures as averages by impressions, but its cited methodology does not specify the aggregation weighting. A monthly total, mean post rate and median post rate answer different questions.
What is a good LinkedIn engagement rate in 2026?
For business Pages, 5.20% is Socialinsider's reported average in its annual 2026 report, using 2025 observations. Its annual study covers 1.3 million posts from 16,645 business Pages active between January 2024 and December 2025, and measures engagement by impressions.
The 4–6% “good” and 6–10% “excellent” ranges are practical planning bands, not percentiles established by that study. A 5% result can be above a link-post average and below a document-post average. Use the matching format below, then compare with your own account's history.
For personal profiles, Favikon's January 2026 report provides follower-size quartiles. Its nano top quartile starts at 2.4%+, but that is a threshold in Favikon's dataset, not a promise that every rep can reach it within a few months. The report does not state its observation window or complete engagement-rate formula, so do not compare its percentages directly with native impression-based analytics.
Set your target using a consistent calculation and comparable posts, and check whether relevant people engage. An SDR gaining responses from target accounts needs a different evaluation from a company Page attracting broad awareness.
Business Page benchmarks by post format: 2025 annual data
Socialinsider's annual table explicitly labels these values 2024 and 2025. The report's methodology notes that the 2025 figures were presented in its 2026 report because a full year of 2026 data was not yet available.
| Post format | 2024 average | 2025 average |
|---|---|---|
| Native document | 6.10% | 7.00% |
| Multi-image | 6.60% | 6.45% |
| Video | 5.60% | 6.00% |
| Single image | 4.85% | 5.30% |
| Text-only | 4.00% | 4.50% |
| Poll | 4.40% | 4.20% |
| Link | 3.30% | 3.25% |
These are business Page averages by impressions, drawn from the annual study of 1.3 million posts across 16,645 Pages. Socialinsider reports year-over-year increases of 14% for documents, 7% for video, 9% for images and 12% for text. Those are its reported rounded changes; the table values are also rounded.
Native documents led at 7.00%; link posts had the lowest average at 3.25%. Text-only posts averaged 4.50%, with Socialinsider reporting 12% year-over-year growth.
Use format averages to choose a test, not to decide the outcome in advance. A document is useful when the information benefits from several pages. A text post is useful when the point can be understood without slides.
Latest quarterly format benchmarks: Q2 2026
Socialinsider's separate Q2 update changes the order at the top: multi-image posts average 6.90%, ahead of native documents at 6.60%.
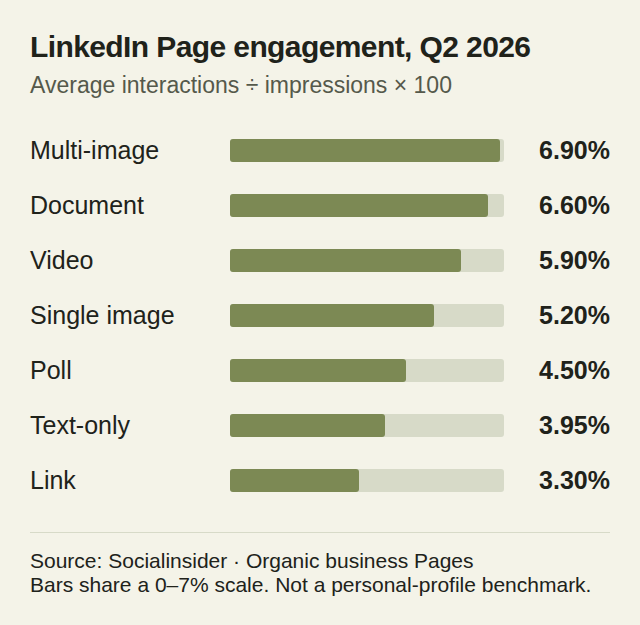
Multi-image and document posts lead this quarterly Page dataset. Exact values are also available in the table:
| Post format | Q2 2026 average |
|---|---|
| Multi-image | 6.90% |
| Native document | 6.60% |
| Video | 5.90% |
| Single image | 5.20% |
| Poll | 4.50% |
| Text-only | 3.95% |
| Link | 3.30% |
Source: Socialinsider's Q2 2026 LinkedIn update, engagement by impressions for business Pages. The quarterly section does not provide a separate post/Page sample count. The annual 1.3-million-post sample should not be presented as the Q2 sample.
Keep the quarterly and annual tables separate. They cover different periods. The published methodology does not show whether the same Pages were studied in both, so the tables do not establish a like-for-like change. Neither table is a personal-profile benchmark.
Personal-profile benchmarks by follower count
Favikon's January 2026 analysis reports four quartile bands for each creator tier. The middle-lower band is Q2, not a median range. The median is the boundary between Q2 and Q3; Favikon explicitly identifies 1.1% as the nano median.
| Profile size | Median boundary | Top quarter (Q4) |
|---|---|---|
| Nano: 0–10K | 1.1% | 2.4%+ |
| Micro: 10K–100K | 0.3% | 0.7%+ |
| Macro: 100K–500K | 0.18% | 0.45%+ |
| Mega: 500K+ | 0.05% | 0.15%+ |
Full bands below run from Q1 (bottom quarter) through Q2 (middle-lower), Q3 (middle-upper), and Q4 (top quarter). Median boundaries in the table are the shared Q2/Q3 endpoints in the source's rounded bands.
- Nano, 0–10K: Q1 0–0.5%; Q2 0.5–1.1%; Q3 1.1–2.4%; Q4 2.4%+.
- Micro, 10K–100K: Q1 0–0.15%; Q2 0.15–0.3%; Q3 0.3–0.7%; Q4 0.7%+.
- Macro, 100K–500K: Q1 0–0.06%; Q2 0.06–0.18%; Q3 0.18–0.45%; Q4 0.45%+.
- Mega, 500K+: Q1 0–0.01%; Q2 0.01–0.05%; Q3 0.05–0.15%; Q4 0.15%+.
Favikon's population by tier:
| Profile tier | Total profiles | Active profiles |
|---|---|---|
| Nano | 404,958 | 142,728 |
| Micro | 80,686 | 53,188 |
| Macro | 3,126 | 2,573 |
| Mega | 440 | 333 |
Favikon reports both total and active populations but does not fully explain which filtering rules produce the quartiles, its measurement window, or its exact denominator. Use these bands within Favikon's reporting framework, rather than as thresholds for your native impression-based rate.
Favikon also reports a narrower 5K–10K group: 80,000 total profiles, 41,913 active, with bands of 0–0.30%, 0.30–0.62%, 0.62–1.25%, and 1.25%+. That subgroup overlaps the broader nano tier; it is not an additional independent population to add to the table's total.
Favikon reports lower percentage thresholds for larger follower tiers. This does not prove that growing an individual account causes its engagement to fall. For sales teams, a smaller relevant audience can be more useful than a large unrelated one. Evaluate the people and conversations behind the rate rather than connecting indiscriminately to improve a metric.
What the comment-reply research found
Replying to useful comments is worth testing. Buffer's December 2025 article reports about 30% higher engagement counts on posts with replied-to comments. That finding concerns interactions, rather than impression-based engagement rate or sales pipeline.
Its underlying analysis by Julian Winternheimer gives the exact regression sample: 72,211 LinkedIn posts across 24,963 profiles. About 83% of profiles eligible for the paired Z-score comparison showed a positive difference. That comparison requires at least three posts, variation in engagement, and posts both with and without replied-to comments; it is a subset of the full regression population.
The source query starts with posts sent from January 1, 2025, with at least one recorded comment. It does not specify an exact end date. The analysis appeared in October 2025; Buffer's reader-facing summary was published December 4, 2025.
The fixed-effects model compares each profile with itself. A separate Z-score analysis compares post engagement with that profile's baseline. The outcome is engagement count, including reactions, comments, shares and clicks, with a fallback to likes plus comments when the main field is unavailable. It is not a study of a 30% increase in impression-based engagement rate, DM replies or pipeline.
There are two important limits. Only 5,659 posts in the displayed summary had replied comments, versus 66,552 without. The analysis lacks timestamps showing whether engagement came before or after a reply, and comments are themselves part of the engagement outcome. Popular posts may encourage more replies. The result is an association, not proof that replying causes a 30% lift.
Do comments count more than likes?
In the simple rate formula, each counted reaction or comment adds one interaction. Ten comments plus 30 likes equals 40 interactions; 50 likes equals 50, before shares or clicks. At equal impressions, the second post has the higher numerical rate. These counts cannot establish which post LinkedIn will distribute more widely.
Comments can still be more useful for a sales conversation because they reveal a question, objection or point of view you can answer. That is a reason to prioritize thoughtful discussion, not a measured ranking-weight multiplier.
How SDRs and AEs can use the benchmarks
Start with two separate questions: is your content engaging its audience, and are you building relationships with the people you need to reach?
- Keep a comparable content log. Record account type, format, publication date, impressions and the interactions included in your calculation. Compare posts at a consistent age so a fresh post is not judged against one that has had weeks to accumulate engagement. Log follower count too if you calculate a follower-based rate.
- Reply to useful comments. A first-day reply routine is a practical way to stay responsive, not a timing rule proved by Buffer's study. Answer the actual question or add a relevant detail rather than posting a generic thank-you everywhere.
- Comment on target accounts before reaching out. Use warm outreach to build familiarity around something the prospect has said. A week or two of relevant engagement can be a working cadence, but does not guarantee a reply or a higher post engagement rate. See the separate warm-outreach reply-rate breakdown for that workflow's reported results.
- Test formats that fit the material. Use documents or multi-image posts for information that needs several steps or visuals. Keep text when it communicates the idea better. Compare your own results before changing your whole publishing mix.
- Track relationship outcomes separately. Record target-account responses, substantive DM conversations and agreed next steps. A reaction shows engagement; it does not establish buying intent. Engagement-led prospecting gives this work a repeatable cadence for both new-account outreach and account executives staying close to existing customers.
What to do with your result
- Low rate, rising impressions: check whether distribution grew faster than interactions. Review absolute interactions and who engaged before abandoning the topic.
- High rate, few impressions: check whether the post reached enough relevant people. Assess response quality and test another topic or format for reach.
- Below the matching format average: check post age, numerator and organic/paid scope. Test the opening and substance on comparable posts.
- More likes, no target-account responses: review the people behind the reactions. Choose topics relevant to their work and your sales focus.
- One exceptional post: compare it with the rest of the period. Keep the mean, median and underlying counts rather than setting the next target from one outlier.
Prioritize the prospects whose posts deserve a response
Extrovert's LinkedIn monitoring brings tracked people and topics into one feed. The comment-prioritization strategies shown below help you focus your daily work on relevant prospects. Review the post and proposed comment before sending; the benchmark does not tell you which prospect needs your attention.
Extrovert helps organize prospect engagement and AI-assisted follow-ups. You choose what to review or automate. Use your analytics export for benchmark calculations and Extrovert for the relationship work that follows.
Illustration: the posts a campaign found, sorted three ways. Newest posts, newest first: Just now, 20 min ago, 3 h ago, Yesterday. Closest to outreach, fewest comments left before outreach first: 1 left, 2 left, 3 left, 4 left. Evenly distribute, longest since your last comment first: 6 weeks ago, 3 weeks ago, Last week, Yesterday.
Newest posts
In a visibility campaign, the newest posts come first, so your comment goes up while people are still reading.
Closest to outreach
In a warm outreach campaign, the people who need only one or two more comments before you reach out come first, so you get to the first DM sooner.
Evenly distribute
In a nurturing campaign, the people you have not commented on for the longest come first, so nobody on the list is forgotten.


Turn a relevant post into a follow-up
A prospect's post can give you a concrete reason to restart a conversation. The Conversation Restarter illustration shows how Extrovert uses a prospect's post to suggest a DM for you to review before acting. Keep the follow-up tied to what the person said and measure the resulting conversation separately from content engagement.
Illustration: Extrovert reads the prospect's posts. hot take, thought leadership, motivation, promotion are skipped. One post, went to sf tech week, is a Restarter signal. Extrovert suggests the DM "Seen you went to SF Tech Week. How did it go?", and the prospect replies.

A 15-minute daily routine can be a useful starting cadence specifically for reviewing prospect posts and replying, rather than for your entire outreach workflow. It is a workflow choice, not a benchmark-derived guarantee of trust, engagement or pipeline. Extrovert for SDRs shows how to organize that work without restarting your prospect list each week.
FAQ
What is the average LinkedIn engagement rate in 2026?
Socialinsider's annual 2026 report gives a 5.20% business Page average, but explicitly identifies the annual values as 2025 data. Its Q2 2026 update reports format-specific averages, including 6.90% for multi-image posts and 6.60% for native documents. It does not supply a new overall quarterly average in the cited section.
What is a good engagement rate for a personal LinkedIn profile?
Favikon reports top-quartile thresholds of 2.4%+ for nano profiles, 0.7%+ for micro, 0.45%+ for macro and 0.15%+ for mega. These are that source's creator-tier observations, not universal goals. Its report does not fully specify the observation period or formula, so compare your own posts using a consistent calculation as well.
Why do two LinkedIn engagement reports show different numbers?
They may count different interactions, use impressions versus followers, study Pages versus personal profiles, report an average versus a median, or cover different periods. Check all five before comparing a percentage.
Which LinkedIn post format has the highest engagement?
Native documents led Socialinsider's annual 2025 business Page table at 7.00%. Multi-image posts led its newer Q2 2026 update at 6.90%. These are impression-based business Page averages, not proof that either format will win on a particular personal profile.
Does replying to comments increase engagement by 30%?
Buffer found an association of about 30% higher engagement counts on posts with replied comments in its within-profile analysis. It did not establish cause and effect, an exact reply deadline, or a corresponding improvement in DM reply rates.
How often should I check engagement rate?
Review weekly to catch patterns, but compare posts at the same age and use a longer view when you publish infrequently. Keep the underlying counts and the quality of responses visible alongside the percentage.